Synthetic data
Synthetic images
The SyntheticImage class enables the creation of images containing simple geometric shapes.
Creating a synthetic image
To create an empty image, load the SyntheticImage class and specify the desired image shape in order (x, y, z), e.g.
from skrt.simulation import SyntheticImage

sim = SyntheticImage((250, 250, 50))
The following arguments can be used to adjust the image’s properties:
voxel_size: voxel sizes in mm in order (x, y, z); default (1, 1, 1).origin: position of the top-left voxel in mm; default (0, 0, 0).intensity: value of the background voxels of the image.noise_std: standard deviation of Gaussian noise to apply to the image. This noise will also be added on top of any shapes. (Can be changed later by altering thesim.noise_stdproperty).
Adding shapes
The SyntheticImage object has various methods for adding geometric shapes. Each shape has the following arguments:
intensity: intensity value with which to fill the voxels of this shape.above: ifTrue, this shape will be overlaid on top of all existing shapes; otherwise, it will be added below all other shapes.
The available shapes and their specific arguments are:
Sphere:
sim.add_sphere(radius, centre=None)radius: radius of the sphere in mm.centre: position of the centre of the sphere in mm (ifNone, the sphere will be placed in the centre of the image).
Cuboid:
sim.add_cuboid(side_length, centre=None)side_length: side length in mm. Can either be a single value (to create a cube) or a list of the (x, y, z) side lengths.centre: position of the centre of the cuboid in mm (ifNone, the cuboid will be placed in the centre of the image).
Cube:
sim.add_cube(side_length, centre=None)Same as
add_cuboid.
Cylinder:
sim.add_cylinder(radius, length, axis='z', centre=None)radius: radius of the cylinder in mm.length: length of the cylinder in mm.axis: either'x','y', or'z'; direction along which the length of the cylinder should lie.centre: position of the centre of the cylinder in mm (ifNone, the cylinder will be placed in the centre of the image).
Grid:
sim.add_grid(spacing, thickness=1, axis=None)spacing: grid spacing in mm. Can either be a single value, or list of (x, y, z) spacings.thickenss: gridline thickness in mm. Can either be a single value, or list of (x, y, z) thicknesses.axis: if None, gridlines will be created in all three directions; if set to'x','y', or'z', grids will only be created in the plane orthogonal to the chosen axis, such that a solid grid runs through the image along that axis.
To remove all shapes from the image, run
sim.reset()
Plotting
The SyntheticImage class inherits from the Image class, and can thus be plotted in the same way by calling
sim.plot()
along with any of the arguments available to the Image plotting method.
Rotations and translations
Rotations and translations can be applied to the image using:
sim.translate(dx, dy, dz)
or
sim.rotate(pitch, yaw, roll)
Rotations and translations can be removed by running
sim.reset_transforms()
Getting the image array
To obtain a NumPy array containing the image data, run
array = sim.get_data()
This array will contain all of the added shapes, as well as having any rotations, translations, and noise applied.
Saving
The synthetic image can be written to an image file by running
sim.write(outname)
The output name outname can be:
A path ending in
.niior.nii.gz: image will be written to a nifti file.A path ending in
.npy: image will be written to a binary NumPy file.A path to a directory: image will be written to dicom files (one file per slice) inside the directory.
The write function can also take any of the arguments of the Image.write() function.
Adding structures
When shapes are added to the image, they can also be set as ROIs. This allows you to:
Plot them as contours or masks on top of the image;
Access a
StructureSetobject containing the ROIs;Write ROIs out separately as masks or as a dicom structure set file.
Single ROIs
To assign a shape as an ROI, you can either give it a name upon creation, e.g.:
sim.add_sphere(50, name='my_sphere')
or set the is_roi property to True (the ROI will then be given an automatic named based on its shape type):
sim.add_sphere(50, is_roi=True)
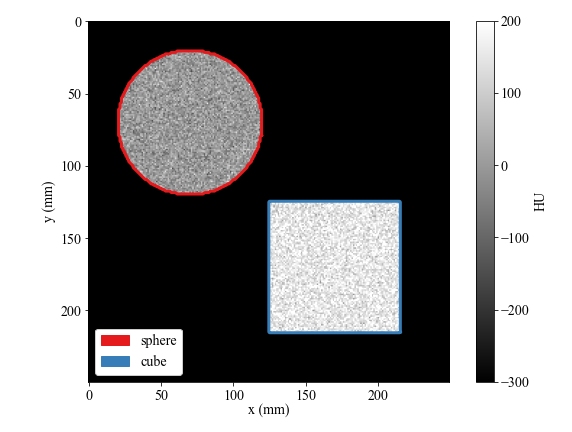
When sim.plot() is called, its ROIs will automatically be plotted as contours. Some useful extra options to the plot function are:
roi_plot_type: set plot type to any of the validROIplotting types (mask, contour, filled, centroid, filled centroid).centre_on_roi: name of ROI on which the plotted image should be centred.roi_legend: set toTrueto draw a legend containing the strutcure names.
Grouped shapes
Multiple shapes can be combined to create a single ROI. To do this, set the group argument to some string when creating shapes. Any shapes created with the same group name will be added to this group.
E.g. to create a single ROI called “two_cubes” out of two cubes centred at different positions, run:
sim.add_cube(10, centre=(5, 5, 5), group='two_cubes')
sim.add_cube(10, centre=(7, 7, 5)), group='two_cubes')
Getting ROIs
To get a StructureSet object containing all of the ROIs belonging to the image, run:
structure_set = sim.get_structure_set()
You can also access a single ROI as an ROI object by running:
roi = sim.get_roi(name)
Saving ROIs
When the SyntheticImage.write() function is called, the ROIs belonging to that image will also be written. If the provided outname is that of a nifti or NumPy file, the ROIs will be written to nifti or Numpy files, respectively, inside a directory with the same name as outname but with the extension removed.
Synthetic Patient objects
The Patient class can be used to create a custom patient object from scratch, rather than loading a prexisting patient.
To do this, first create a blank Patient object with your chosen ID:
from skrt import Patient

p = Patient("my_id")
Studies can then be added to this object. Optional arguments for adding a study are:
subdir: a custom subdirectory in which the study will be nested when the Patient tree is written;timestamp: a custom timestamp (if not set, this will be automatically generated)images: a list of Image objects to associate with this study (note, Images can also be added to the Study later)image_type: the type of image correspoding to the Images inimages, if used (e.g.CT); this will determine the name of the directory in which the images are saved when the Patient tree is written.
E.g. to add one study containing a single synthetic image with one ROI:
from skrt.simulation import SyntheticImage

im = SyntheticImage((100, 100, 30))
im.add_sphere(radius=10, name="my_sphere")

p.add_study("my_study", images=[im], image_type="MR")
The patient tree can then be written out:
p.write(outdir="some_dir")
This will create a patient directory somedir/my_id containing the added study and its corresponding image and structure set.